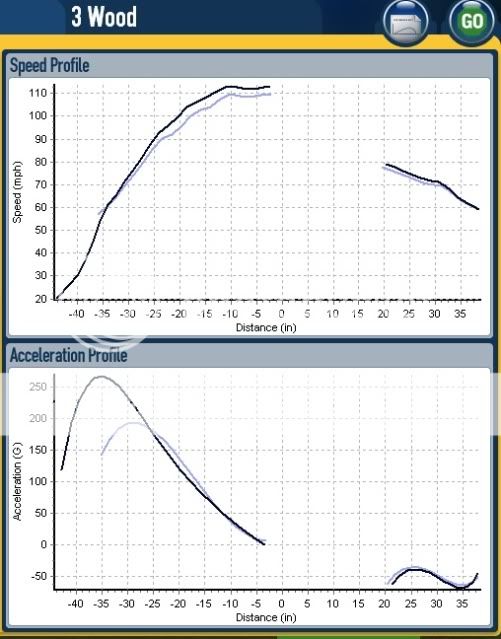
On the top graph you see the club head peak around 112ish mph +/- 10" from impact. Then you see a +/- 1mph dip and then a
recovery back to 112ish over the remaining distance to impact. That dip and recovery is the shaft going through its recovery. I wouldn't consider that a slow down, but rather a net coast. How well the shaft fits plays a
big role in what those last several inches look like.
I see what you're saying about the appearance of what would be a negative acceleration just before impact (if the line kept going), but the graph lines stop at impact. In this case they do not coincide exactly with the reference lines (inches) at the bottom of the graph. At least that's what I was told.
")